| Expression Analysis |
| -Expression Profile |
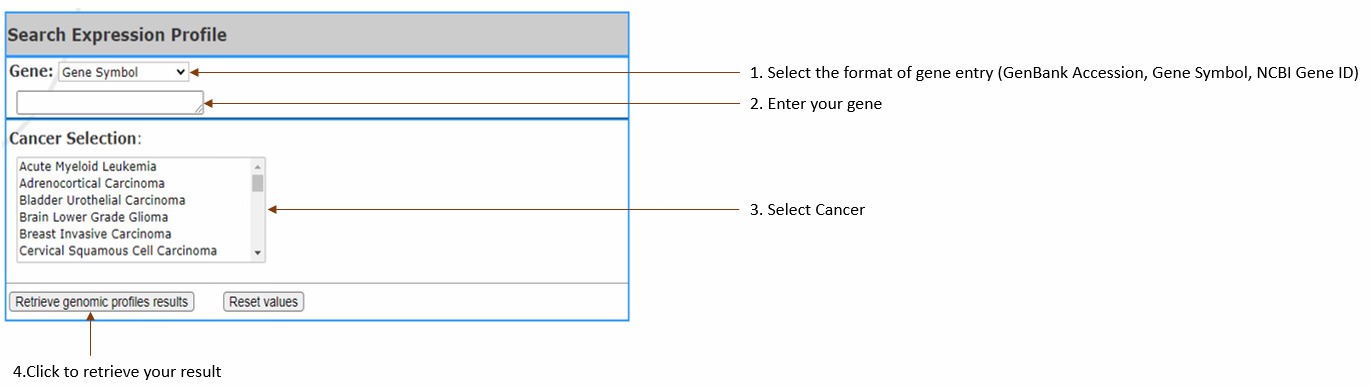
Compare gene
expression level in
cancer vs normal according to the selected cancer types by generating box plots, along with a table of gene information.
(RNA-Seq is normalized, using TPM to show the
expression level.).
-You may enter single gene and select up to 3 cancers or enter up to 3 genes and select a single cancer. You can NOT enter multiple genes and select multiple cancers at the same time.
- Gene:
Select gene input format (Gene symbol,Gene
Accession,NCBI Gene ID) and enter your gene(s) of interest. You can enter
3
at most,
separated by
comma.
- Cancer Selection: Select cancer by clicking on
the one you are in interested in. Multiple cancer types may be selected, 3 at most, if there is only one gene input.
|
| -Differential Expression |
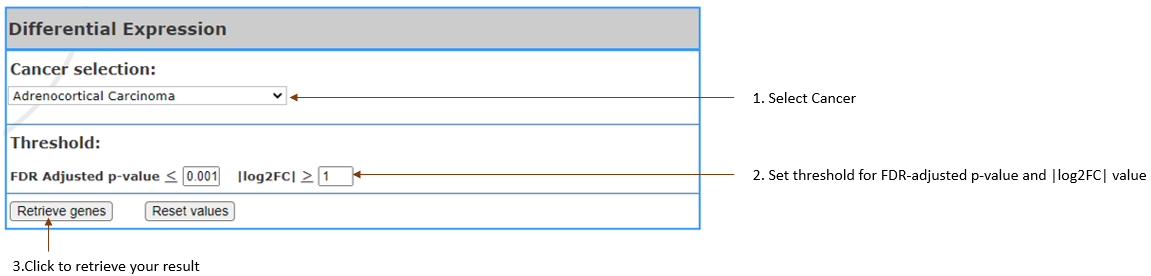
Retrieve the list of genes that expression levels are most differential between normal and cancer samples .
-
Cancer selection: Select
cancer by clicking on the one you are in
interest. It can also be selected multiple.
-
Threshold: Setting
the threshold to filter list of genes.
-
FDR Adjusted p-value:
Set custom FDR(False Discovery Rate) adjusted p-value (q-value). Return genes with a q-value equal to or lower than threshold.
-
|log2FC|: Set
the log2 transformed fold
change.(upregulated/downregulated)
|
| -Correlation Expression |
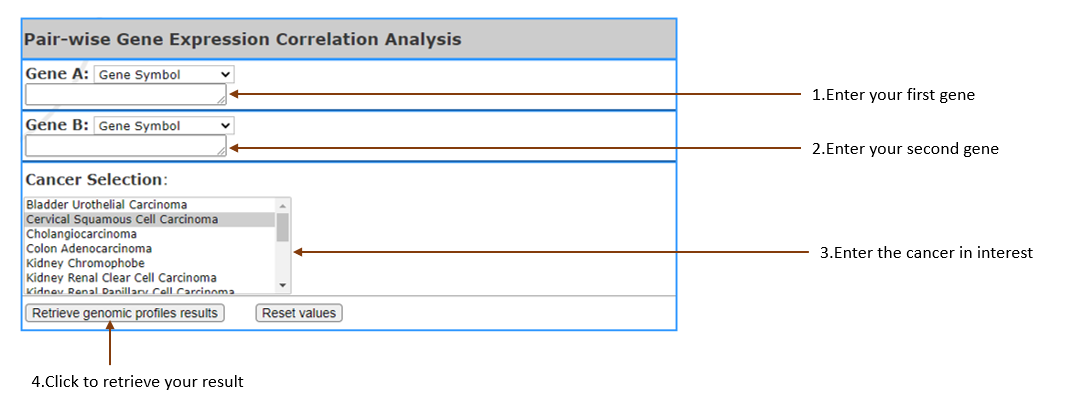
Check pairwise correlation coefficients between gene expression levels. Scatter plots visualizing the correlation between gene expression log2 TPMs are generated along with a table of gene information.
(RNA-Seq data is normalized using log2 transformed TPM.)
-
GeneA, GeneB:
Select gene input format (Gene symbol,Gene Accession,NCBI Gene ID) and enter your gene of interest.
-
Cancer Selection:
Select cancer by clicking on the one you are in interest.Multiple cancer types may be selected, 3 at most.
|
| Methylation Analysis |
| -Methylation Profile |
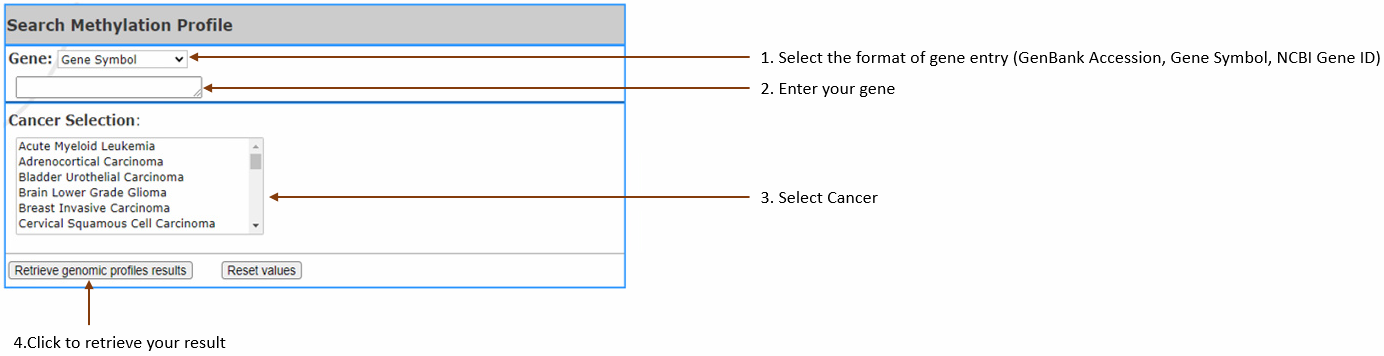
Compare gene methylation levels in cancer vs normal samples of the selected cancer types. Position plots are generated along with a table of gene information
(RNA-Seq is normalized, using
TPM data to show the methylation level.)
-You can enter single gene and select 3 cancers at most or
enter 3 genes at most and select single cancer. You can NOT
enter multiple genes and select multiple cancers at the same
time.
- Gene:
Select gene input format (Gene symbol,Gene
Accession,NCBI Gene ID) and enter your gene of interest.
You can enter 3
at most,
separated by
comma.
- Cancer Selection: Select cancer by clicking on
the one you are in interest.It can also be selected
multiple, 3 at most.
|
| -Differential methylation |
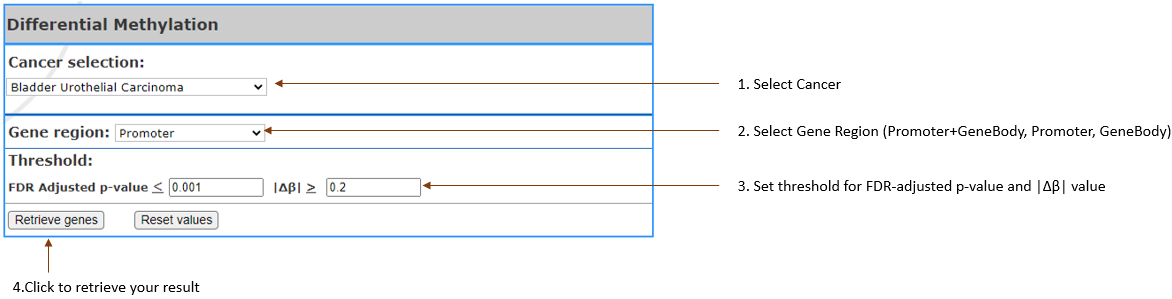
Getting the list of genes that are most
differential between normal and cancer, in
terms of gene methylation.
(Methylation data is measured by Infinium
HumanMethylation450K BeadChip)
- Cancer Selection: Select
cancer by clicking on the one you are in interest.
It can also be selected Multiple.
- Gene region: Select
the region of gene that you are interested (Promoter, GeneBody, Promoter+GeneBody)
- Threshold: Setting
the threshold to filter list of genes.
- FDR Adjusted p-value: Set
custom p-value.
- Δβ: Set
custom beta difference value (beta value is to show the methylation level).
|
| Survival Analysis |
| -Survival Plots |
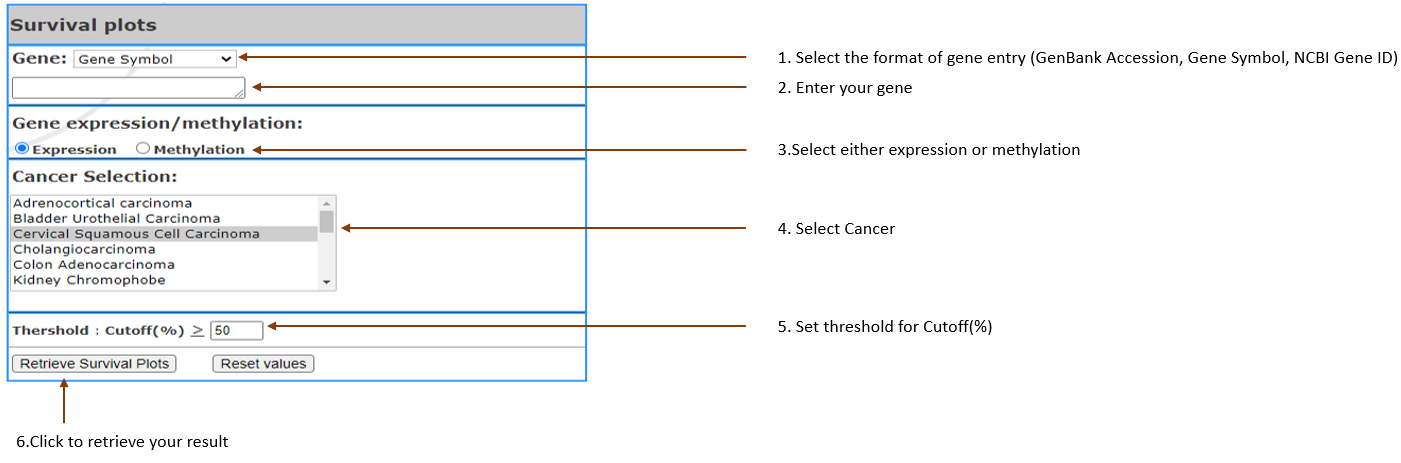
Performing Survival analysis of gene of interest related to the cancer, based on Gene expression or methylation. It creates table of gene info,
significant clinical parameter, and the survival plots showing percent survival vs time.
-
Gene:Select gene input format (Gene
symbol,Gene Accession,NCBI Gene ID) and enter your
gene of interest. You can enter multiple, separated
by Comma.(Limit 3).
- Gene expression/methylation: Select
either expression or methylation to show gene profile.
- Cancer Selection: Select
cancer by clicking on the one you are in interest.
It can also be selected Multiple.(Limit 3)
- Threshold: Setting
the threshold to get certain gene up to customized
threshold.
- Cutoff(%): Set
expression or methylation threshold. Higher than this threshold are considered as the higher cohort and lower will be the low cohorts
|
| -Clinical Association |
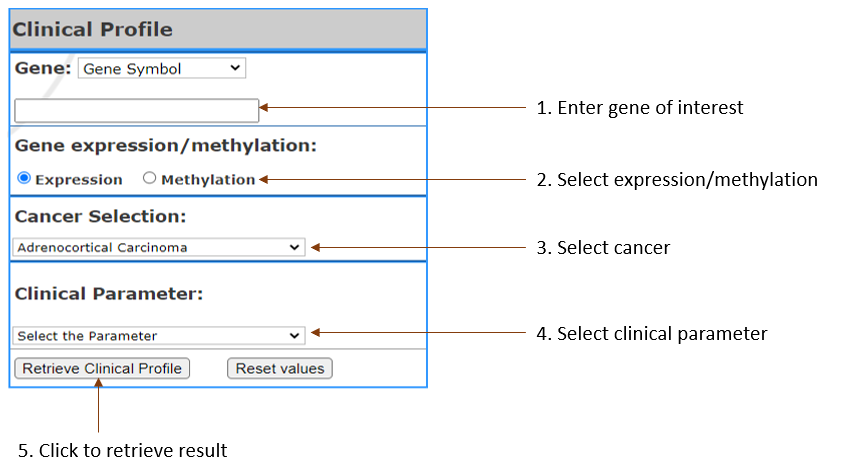
Get the gene expression and methylation profile in the specific clinical parameter that user choose.
- Gene:
Select gene input format (Gene symbol,Gene Accession,NCBI Gene ID) and enter your gene of interest. You can enter multiple, separated by Comma.(Limit 3)
- Cancer Selection:
Select Cancer by clicking on the one you are in interest
- Clinical Parameter:
Select the parameter
- Gene expression/methylation:
Select to show list of genes in terms of expression or methylation.
|
| -Differential Clinical Parameter |
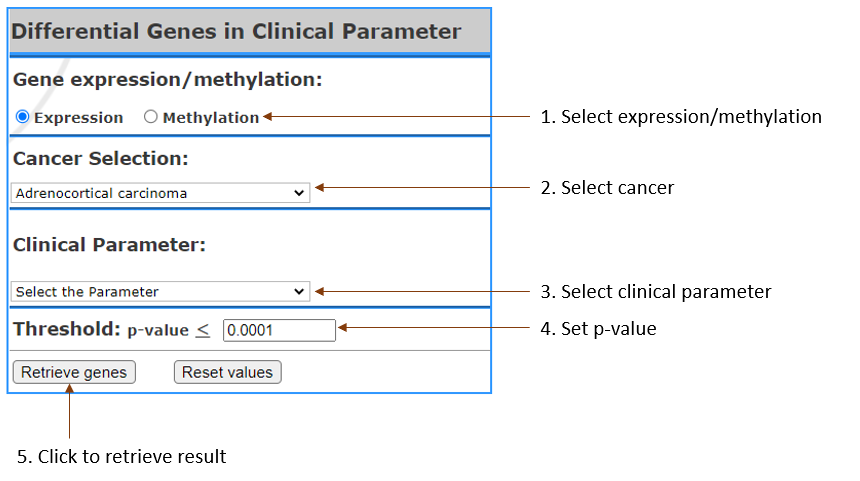
Get the list of differential genes expression or methylation that are significant in
Analysis of variance (ANOVA) tests,
in selected clinical
parameter.
- Cancer Selection: Select
cancer by clicking on the one you are in interest.
It can also be selected Multiple.
- Clinical Parameters: Select
the clinical paramter.
- Gene expression/methylation: Select
to show list of genes in terms of expression or
methylation.
- Threshold: Setting
the threshold to get certain gene up to customized
threshold.
- p-value: Set
custom pvalue.
|
| Oncovirus Analysis |
| -Expression Profile |
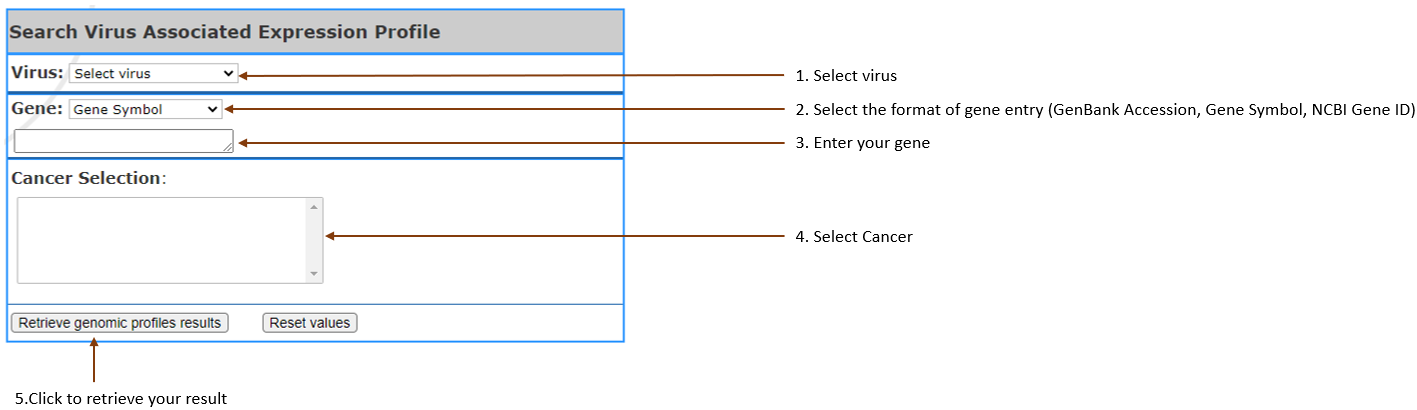
Compare gene
expression
level in viral vs non-viral cancer according to the selected cancer types, by generating box plots.
Also it will generate the table of gene information.
(RNA-Seq
is normalized using TPM to show the
expression level.)
-You can enter single gene and select 3 cancers at most or
enter 3 genes at most and select single cancer. You can NOT
enter multiple genes and select multiple cancers at the same
time.
- Virus type:
Select the virus
in your interest.
- Gene:
Select gene input format (Gene symbol,Gene
Accession,NCBI Gene ID) and enter your gene of interest. You can enter 3 at most,
separated by
comma.
- Cancer Selection:
Select cancer by clicking on the one you are in
interest. It can also be selected multiple, 3 at most.
|
| -Methylation Profile |
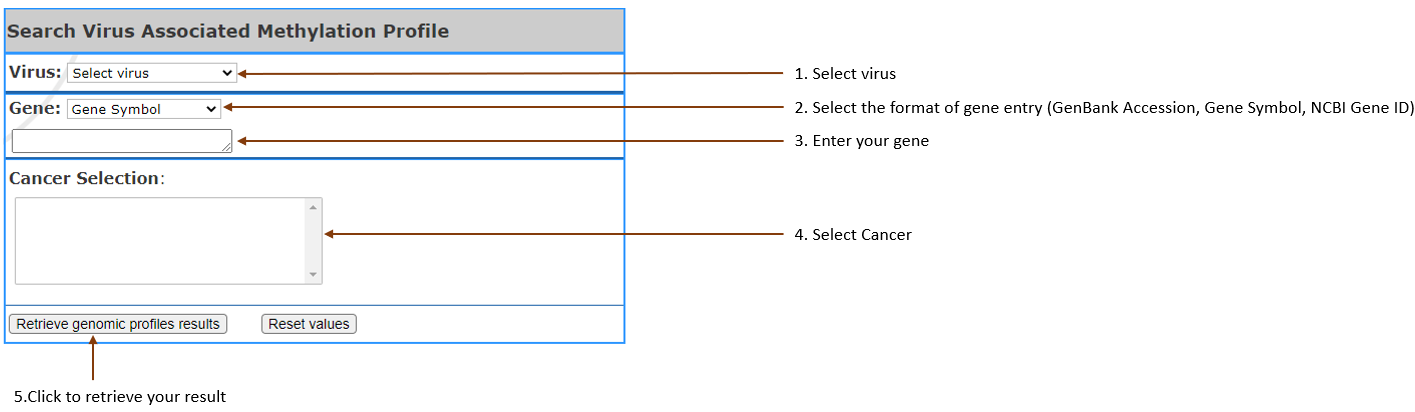
Compare gene
methylation
level in viral vs non-viral cancer according to the
selected cancer, by generating probe position plot
and the table of gene information.
(RNA-Seq
is normalized using TPM to show the methylation level)
-You can enter single gene and select 3 cancers at most or
enter 3 genes at most and select single cancer. You can NOT
enter multiple genes and select multiple cancers at the same
time.
- Virus type:
Select the virus in your interest.
- Gene:
Select gene input format (Gene symbol,Gene
Accession,NCBI Gene ID) and enter your gene of interest. You can enter 3 at most,
separated by
comma.
- Cancer Selection: Select cancer by clicking on
the one you are in interest. It can also be selected
multiple, 3 at most
|
| -Differential Expression |
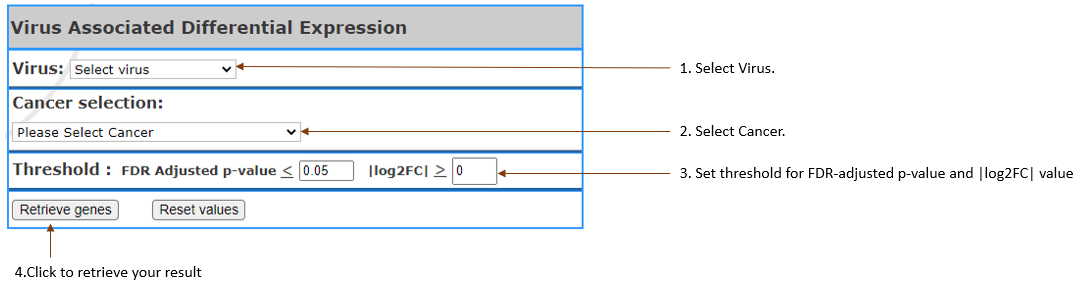
Getting the list of genes that are most
differential between virus and non-virus
infected cancer, in terms
of gene expression.
-
Virus type(s): Select
the virus in your interest.
-
Cancer selection: Select
cancer by clicking on the one you are in
interest. It can also be selected multiple.
-
Threshold: Setting
the threshold to filter list of genes.
-
FDR Adjusted p-value: Set
custom p value.
-
|log2FC|: Set
the log2 transformed fold
change.(log2(median(viral)/log2(median(non-viral)))
|
| -Differential Methylation |
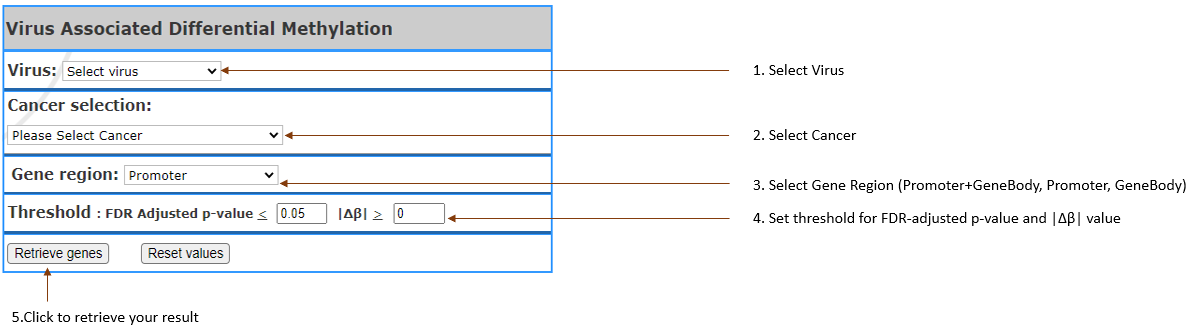
Getting the list of genes that are most
differential between virus and non-virus, in
terms of gene methylation.
(Methylation data is measured by Infinium
HumanMethylation450K BeadChip)
-
Virus type(s): Select
the virus in your interest.
- Cancer Selection: Select
cancer by clicking on the one you are in interest.
It can also be selected Multiple.
- Gene region: Select
the region of gene that you are interested (Promoter, GeneBody, Promoter+GeneBody)
- Threshold: Setting
the threshold to filter list of genes.
- FDR Adjusted p-value: Set
custom p-value.
- Δβ: Set
custom beta difference value (beta value is to show the methylation level).
|
| -Survival Plots |
GeneAssociated Survival Plots
|
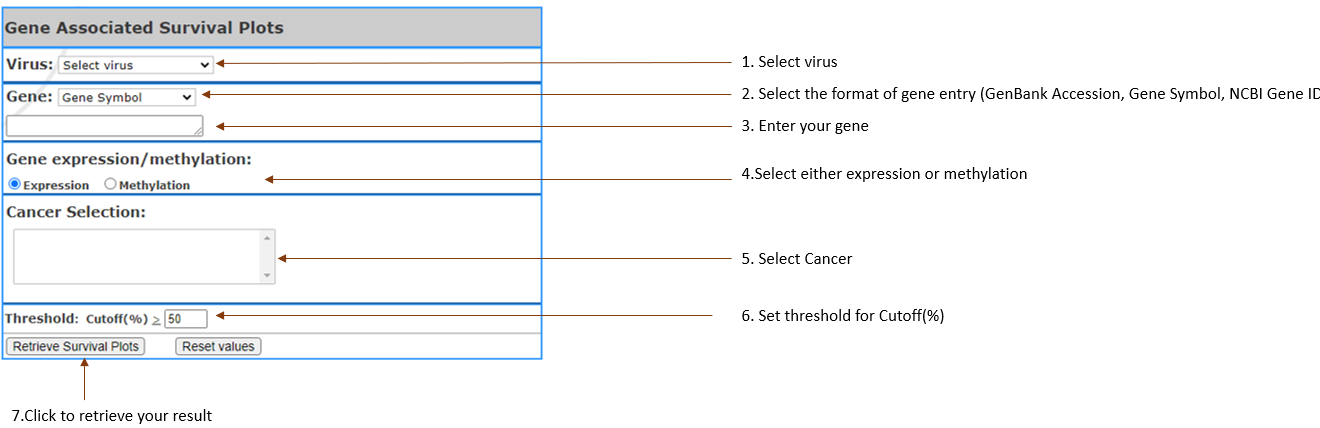
Performing survival analysis in gene of interest
which is associated with virus, based on gene expression or methylation. It creates table of gene info, and the survival plots showing percent survival vs time.
-
Virus type(s): Select
the virus in your interest.
-
Gene:Select gene input format (Gene
symbol,Gene Accession,NCBI Gene ID) and enter your
gene of interest. You can enter multiple, separated
by Comma.(Limit 3).
- Gene expression/methylation: Select
either expression or methylation to show gene profile.
- Cancer Selection: Select
cancer by clicking on the one you are in interest.
It can also be selected up to 3 (Limit 3).
- Threshold: Setting
the threshold to get certain gene up to customized
threshold.
- Cutoff(%): Set
expression or methylation threshold. Higher than this threshold are considered as the high cohort and lower will be the low cohorts
|
Virus Associated Survival Plots
|
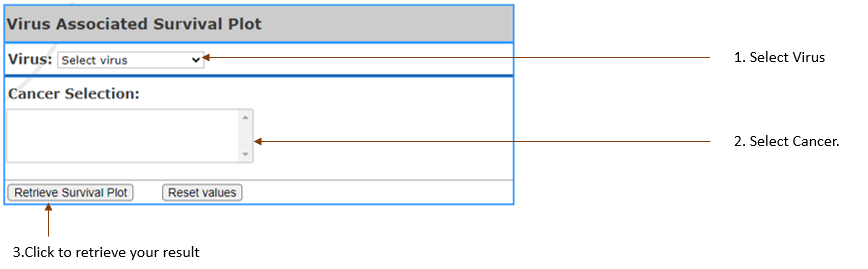
Performing Survival analysis based on virus vs non-virus.
The survival plots showing percent
survival vs time.
-
Virus type(s): Select
the virus in your interest.
- Cancer Selection: Select
cancer by clicking on the one you are in interest.
It can be selected up to 3 (Limit 3).
- Threshold: Setting
the threshold to get certain gene up to customized
threshold.
- Cutoff(%): Set
expression or methylation threshold. Higher than this threshold are considered as the high cohort and lower will be the low cohorts
|
| -Clinical Association |
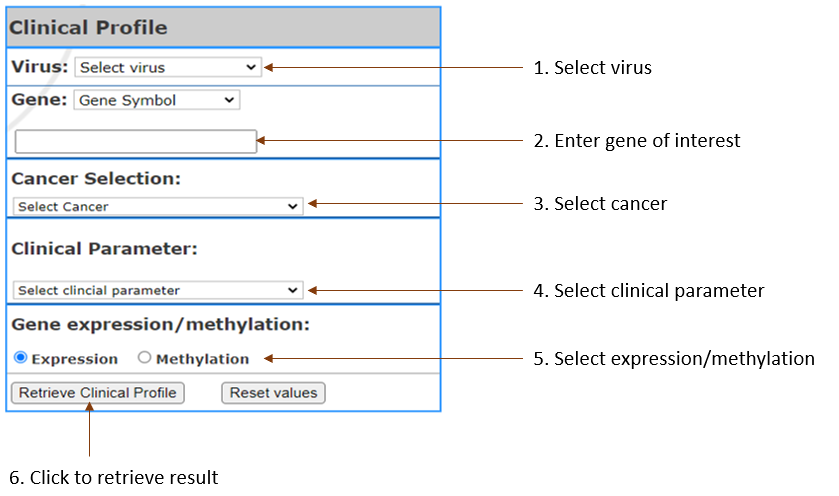
Get the gene expression and methylation profile in the specific clinical parameter related to viral cancer, to compare each stages, and the table of p-values from Analysis of variance (ANOVA) testsin the selected clinical parameter..
- Virus Types:
Select virus of your interest
- Gene:
Select gene input format (Gene symbol,Gene Accession,NCBI Gene ID) and enter your gene of interest. You can enter multiple, separated by Comma.(Limit 3)
- Cancer Selection:
Select Cancer by clicking on the one you are in interest
- Clinical Parameter:
Select the parameter
- Gene expression/methylation:
Select to show list of genes in terms of expression or methylation.
|
| -Differential Clinical Parameter |
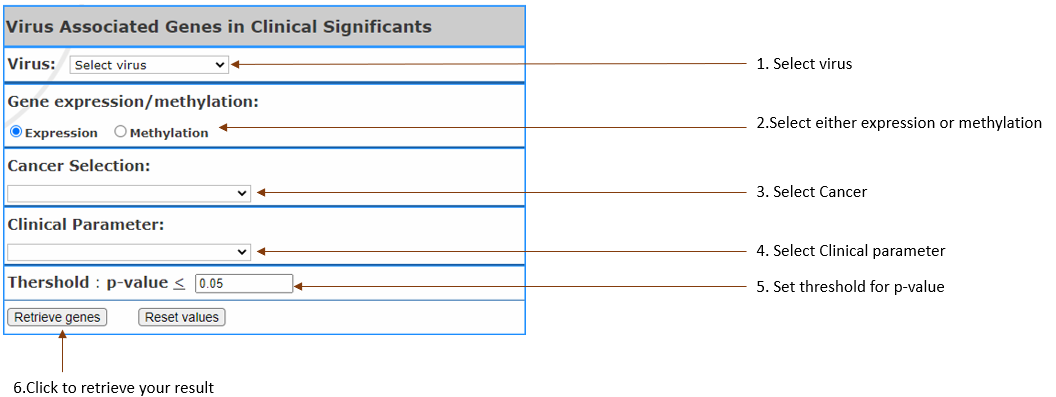
Get the differential genes related to
viral-cancer based on expression or methylation
that are significant in
Analysis of variance (ANOVA) tests in the
selected clinical parameter.
- Virus: Select the virus of your interest
- Cancer Selection: Select
cancer by clicking on the one you are in interest.
- Clinical Parameters: Select
the clinical paramter.
- Gene expression/methylation: Select
to show list of genes in terms of expression or
methylation.
- Threshold: Setting
the threshold to get certain gene up to customized
threshold.
- p-value: Set
custom pvalue.
|