| Expression Analysis |
| -Expression Profile |
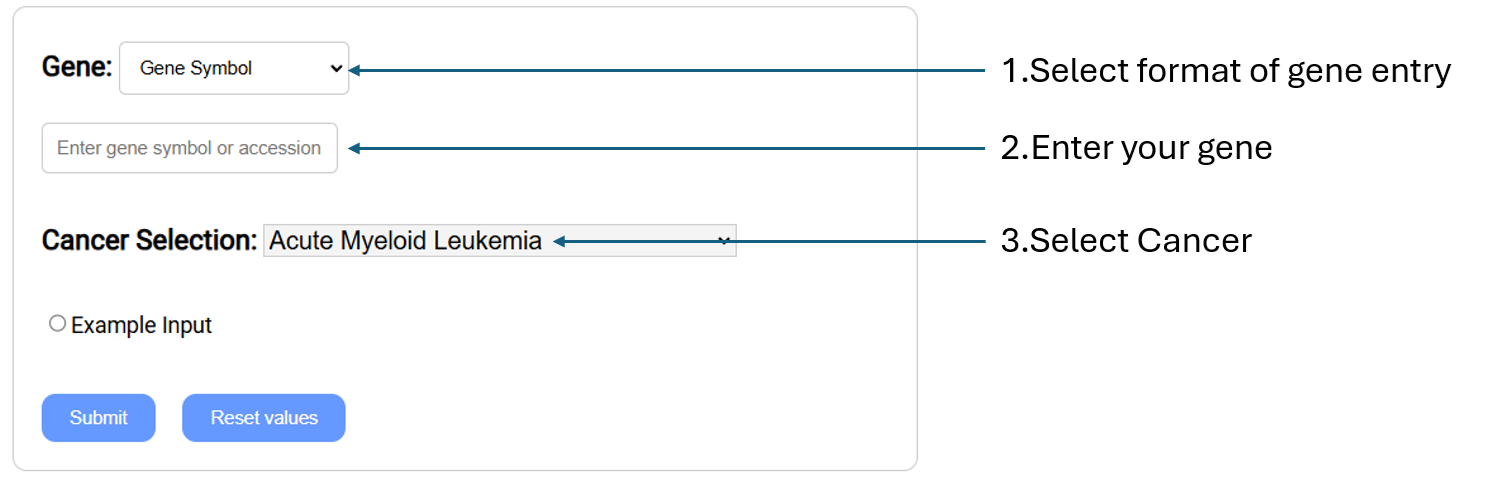
Compare gene expression level in
cancer vs normal according to the selected cancer types by generating box plots, along with a table of gene information.
(RNA-Seq is normalized, using TPM to show the
expression level.).
- Gene:
Select gene input format (Gene symbol,Gene
Accession,NCBI Gene ID) and enter your gene(s) of interest.
- Cancer Selection: Select cancer by clicking on
the one you are in interested in.
*Direct comparison of tumor and normal tissues may identify not only differences related to tumorigenesis, but also differences in tissue composition. Thus, the comparison results should be interpreted with caution.
|
| -Differential Expression |
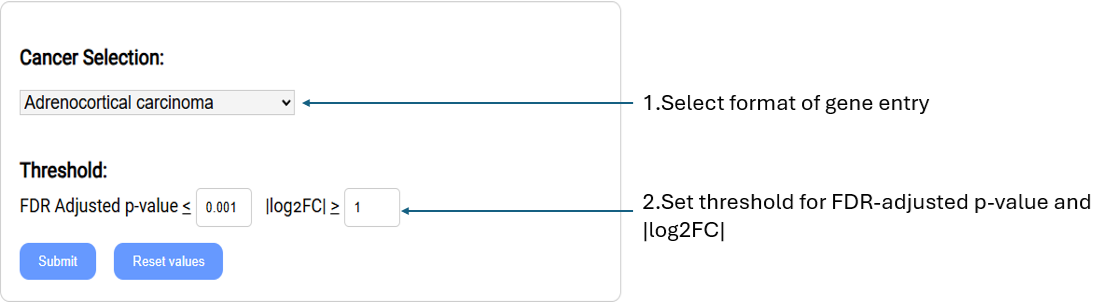
Retrieve the list of genes RNA expression levels are most differentially expressed between normal and cancer samples.
-
Cancer selection: Select cancer type of interest from the drop-down menu.
-
Threshold: Settings used to filter gene list.
-
FDR Adjusted p-value:
Set custom FDR(False Discovery Rate) adjusted p-value (q-value). Return genes with a q-value equal to or lower than threshold.
-
|log2FC|: Set the log2 transformed fold change.(upregulated/downregulated)
|
| -Correlation Expression |

Check pairwise correlation coefficients between gene expression levels. Scatter plots visualizing the correlation between gene expression log2 TPMs are generated along with a table of gene information.
(RNA-Seq data is normalized using log2 transformed TPM.)
-
GeneA, GeneB:
Select gene input format (Gene symbol,Gene Accession,NCBI Gene ID) and enter your gene of interest.
-
Cancer Selection:
Select cancer type of interest from the drop-down menu.
|
| Proteomic Analysis |
| -Proteomic Profile |
Compare protein expression levels in cancer vs normal samples according to the selected cancer types by generating box plots and a table of gene information.
- Gene: Select gene input format (Gene symbol,Gene Accession,NCBI Gene ID) and enter your gene of interest.
- Cancer Selection: Select cancer type of interest from the drop-down menu.
*Direct comparison of tumor and normal tissues may identify not only differences related to tumorigenesis, but also differences in tissue composition. Thus, the comparison results should be interpreted with caution.
|
| -Differential Proteomic Expression |
Retrieve the list of genes whose protein expression levels are most differential between normal and cancer samples.
- Cancer selection: Select cancer type of interest from the drop-down menu.
- Threshold: Settings used to filter gene list.
- FDR Adjusted p-value: Set custom FDR (False Discovery Rate) adjusted p-value (q-value). Return genes with a q-value equal to or lower than threshold.
- |log2FC|: Set the log2 transformed fold change threshold. (upregulated/ downregulated)
|
| Methylation Analysis |
| -Methylation Profile |
Compare gene methylation levels in cancer vs normal samples of the selected cancer types. Position plots are generated along with a table of gene information.
- Gene: Select gene input format (Gene symbol,Gene Accession,NCBI Gene ID) and enter your gene of interest.
- Cancer Selection: Select cancer type of interest from the drop-down menu.
*Direct comparison of tumor and normal tissues may identify not only differences related to tumorigenesis, but also differences in tissue composition. Thus, the comparison results should be interpreted with caution.
|
| -Differential Methylation |

Retrieve the list of genes whose methylation levels are most differential between normal and cancer samples.
(Methylation data is measured by Infinium HumanMethylation450K BeadChip)
- Cancer selection: Select cancer type of interest from the drop-down menu.
- Gene region: Select the region of gene that you are interested (Promoter, GeneBody, Promoter+GeneBody).
- Threshold: Settings used to filter gene list.
- FDR Adjusted p-value: Set custom FDR(False Discovery Rate) adjusted p-value (q-value). Return genes with a q-value equal to or lower than threshold.
- Δβ: Set custom beta difference value (beta value is to show the methylation level).
|
| Mutation Analysis |
| -Mutation Profile |
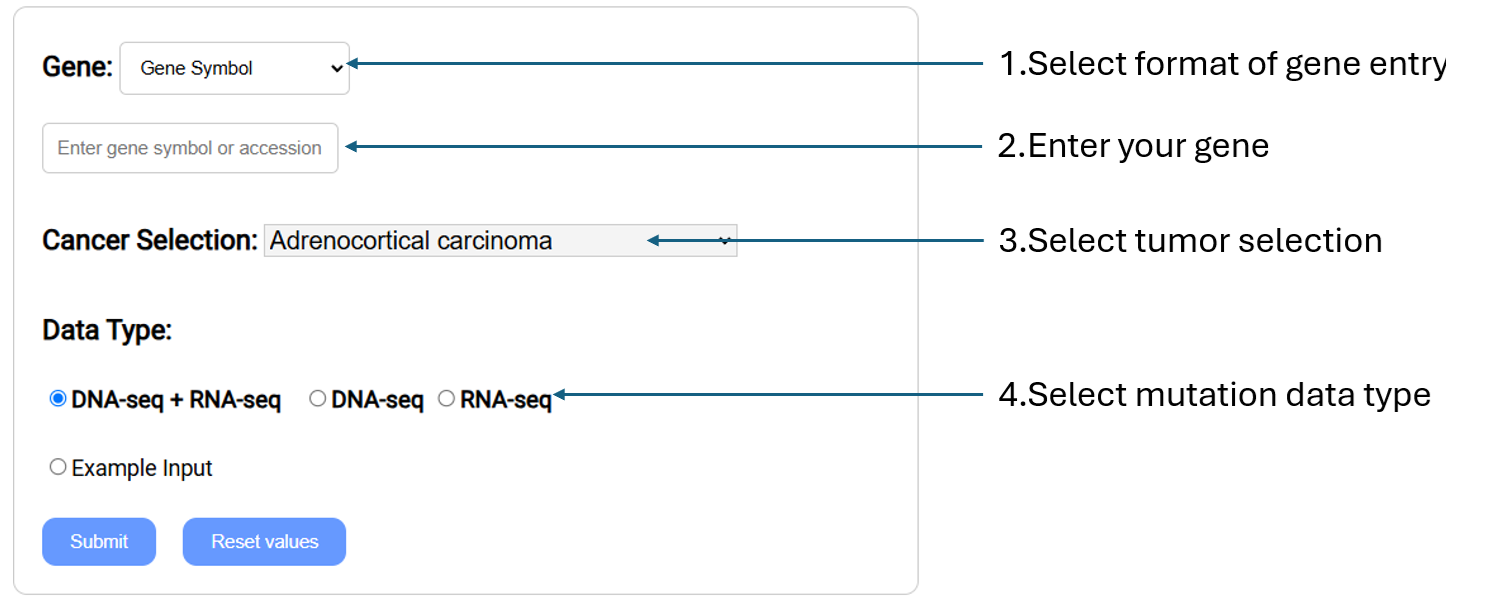
Retrieve somatic mutation profile for a specific gene in selected cancer types and data types by generating mutation plot and table of gene information.
- Gene: Select gene input format (Gene symbol,Gene Accession,NCBI Gene ID) and enter your gene of interest.
- Cancer Selection:Select cancer type of interest from the drop-down menu.
- Data Type: Select the data type for somatic mutation analysis. Somatic mutations can be detected using either DNA-seq or RNA-seq alone, or by combining the results from both sequencing datasets, referred to as "DNA-seq + RNA-seq".
|
| -Significantly Mutated Genes |

Retrieve the list of genes that are most significantly mutated in a certain cancer type. Significantly mutated genes (SMGs) were determined by DNDScv.
- Cancer Selection:Select cancer type of interest from the drop-down menu.
- Threshold: Settings used to filter gene list.
- FDR Adjusted p-value: Set custom FDR(False Discovery Rate) adjusted p-value (q-value). Return genes with a q-value equal to or lower than threshold.
- Mutation percentage: Set cut-off for mutation percentage. Mutation percentage was calculated as the number of patients with the mutation divided by the total number of patients examined.
- Data Type: Select the data type for somatic mutation analysis. Somatic mutations can be detected using either DNA-seq or RNA-seq alone, or by combining the results from both sequencing datasets, referred to as "DNA-seq + RNA-seq".
|
| -Mutation Associated Survival Analysis |

Perform survival analysis on patients of specified cancer stratified by mutation status of each patient. A Survival plot showing percent survival vs time is provided.
- Gene: Select gene input format (Gene symbol,Gene Accession,NCBI Gene ID) and enter your gene of interest.
- Cancer Selection: Select cancer type of interest from the drop-down menu.
- Data Type: Select the data type for somatic mutation analysis. Somatic mutations can be detected using either DNA-seq or RNA-seq alone, or by combining the results from both sequencing datasets, referred to as "DNA-seq + RNA-seq".
|
| -Clinical Profile in Mutation |

Retrieve the somatic mutation profile and associated p-values using Fisher's exact test for the specified clinical parameters.
- Gene: Select gene input format (Gene symbol,Gene Accession,NCBI Gene ID) and enter your gene of interest.
- Cancer Selection: Select cancer type of interest from the drop-down menu.
- Clinical Parameter: Select the clinical parameter.
- Data Type: Select the data type for somatic mutation analysis. Somatic mutations can be detected using either DNA-seq or RNA-seq alone, or by combining the results from both sequencing datasets, referred to as "DNA-seq + RNA-seq".
|
| Chromatin Accessibility |
| -Peak Analysis |
View accessibility of genomic regions in selected gene and tumor within a fixed-width of 501 bp peaks. Pan-cancer level peak information also provided.
- Gene:
Select gene input format (Gene symbol,Gene
Accession,NCBI Gene ID) and enter your gene of interest.
- Cancer Selection: Select cancer type of interest from the drop-down menu.
*Direct comparison of tumor and normal tissues may identify not only differences related to tumorigenesis, but also differences in tissue composition. Thus, the comparison results should be interpreted with caution.
|
| Multiomic Analysis |
| -RNA Expression Relation to Mutation Status |
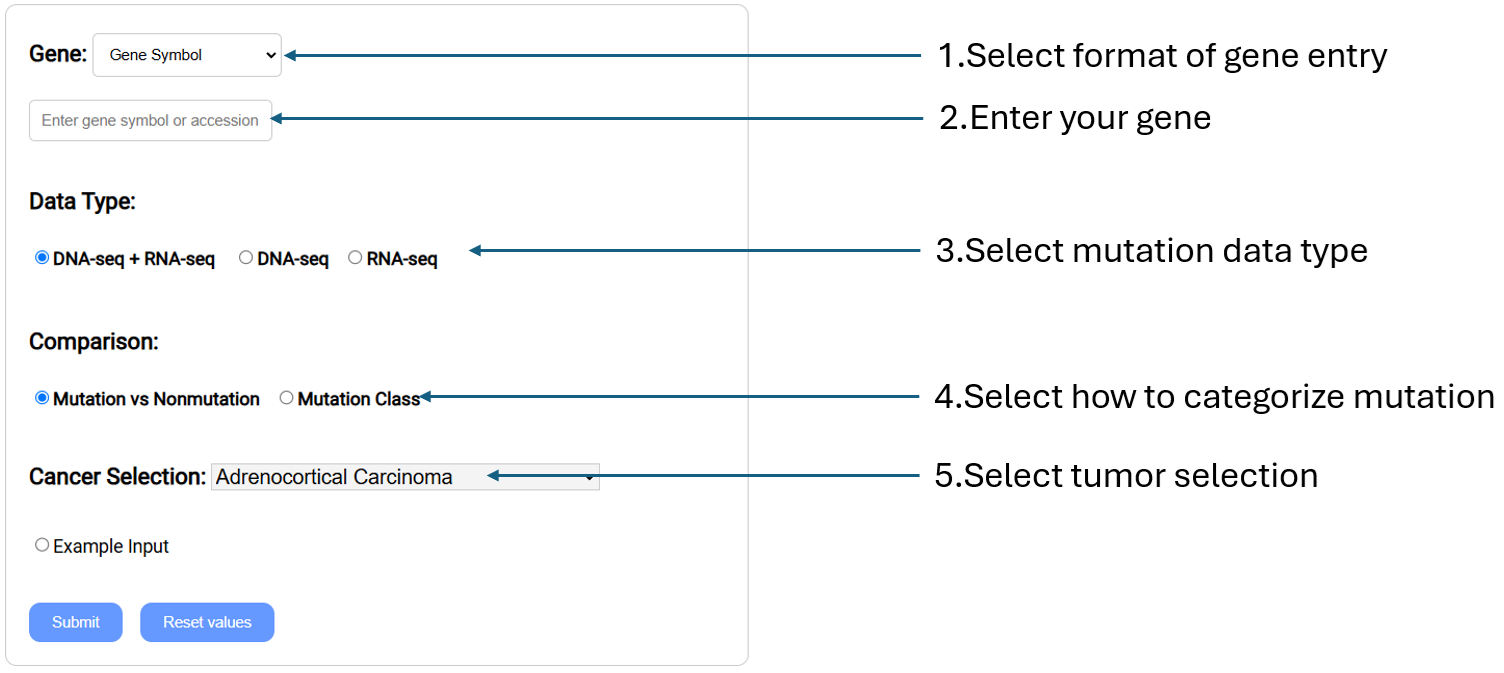
Compare gene expression levels in different mutation statuses according to the selected cancer types by generating box plots and summary information.
- Gene: Select gene input format (Gene symbol,Gene Accession,NCBI Gene ID) and enter your gene(s) of interest.
- Data Type: Select the mutation derived from either DNA-seq, RNA-seq, or both.
- Comparison: Select whether to compare expression levels with those of mutation vs non-mutation samples, or between mutation classes.
- Cancer Selection: Select cancer type of interest from the drop-down menu.
|
| -RNA Expression Relation to Mutation Location |

Compare gene expression levels in different mutation location according to the selected cancer types by generating lollipop plot, along with summary information.
- Gene: Select gene input format (Gene symbol,Gene Accession,NCBI Gene ID) and enter your gene(s) of interest.
- Data Type: Select the mutation derived from either DNA-seq, RNA-seq, or both.
- Cancer Selection: Select cancer type of interest from the drop-down menu.
|
| -Methylation Relation to Mutation Status |
Compare gene methylation levels in different mutation statuses according to the selected cancer types by generating a linear plot and summary information.
- Gene: Select gene input format (Gene symbol,Gene Accession,NCBI Gene ID) and enter your gene(s) of interest.
- Data Type: Select the mutation derived from either DNA-seq, RNA-seq, or both.
- Comparison: Select whether to compare methylation levels with those of mutation vs non-mutation samples, or between mutation classes.
- Cancer Selection: Select cancer type of interest from the drop-down menu.
|
| -Methylation Relation to Mutation Location |
Compare gene methylation levels in different mutation locations according to the selected cancer type by generating lollipops plot, and summary information.
- Gene: Select gene input format (Gene symbol,Gene Accession,NCBI Gene ID) and enter your gene(s) of interest.
- Data Type: Select the mutation derived from either DNA-seq, RNA-seq, or both.
- Cancer Selection: Select cancer type of interest from the drop-down menu.
|
| -Expression vs Methylation Correlation |

Compare gene expression and methylation levels in selected gene and cancer type, using correlation analysis.
- Gene: Select gene input format (Gene symbol,Gene Accession,NCBI Gene ID) and enter your gene(s) of interest.
- Methylation Region: Select which region to focus to get methylation
- Cancer Selection: Select cancer type of interest from the drop-down menu.
|
| Oncovirus Analysis |
| -Expression Profile |

Compare gene expression levels in viral vs non-viral cancer samples according to the selected cancer type by generating box plots and a table of gene information. (RNA-Seq data is normalized using TPM.)
- Virus: Select virus type of interest from the drop-down menu.
- Gene: Select gene input format (Gene symbol,Gene Accession,NCBI Gene ID) and enter your gene of interest.
- Cancer Selection: Select cancer type of interest from the drop-down menu.
|
| -Methylation Profile |
Compare gene methylation levels in viral vs non-viral cancer samples according to the selected cancer types. Position plots are generated along with a table of gene information.
- Virus: Select virus type of interest from the drop-down menu.
- Gene: Select gene input format (Gene symbol,Gene Accession,NCBI Gene ID) and enter your gene of interest.
- Cancer Selection: Select cancer type of interest from the drop-down menu.
|
| -Differential Expression |
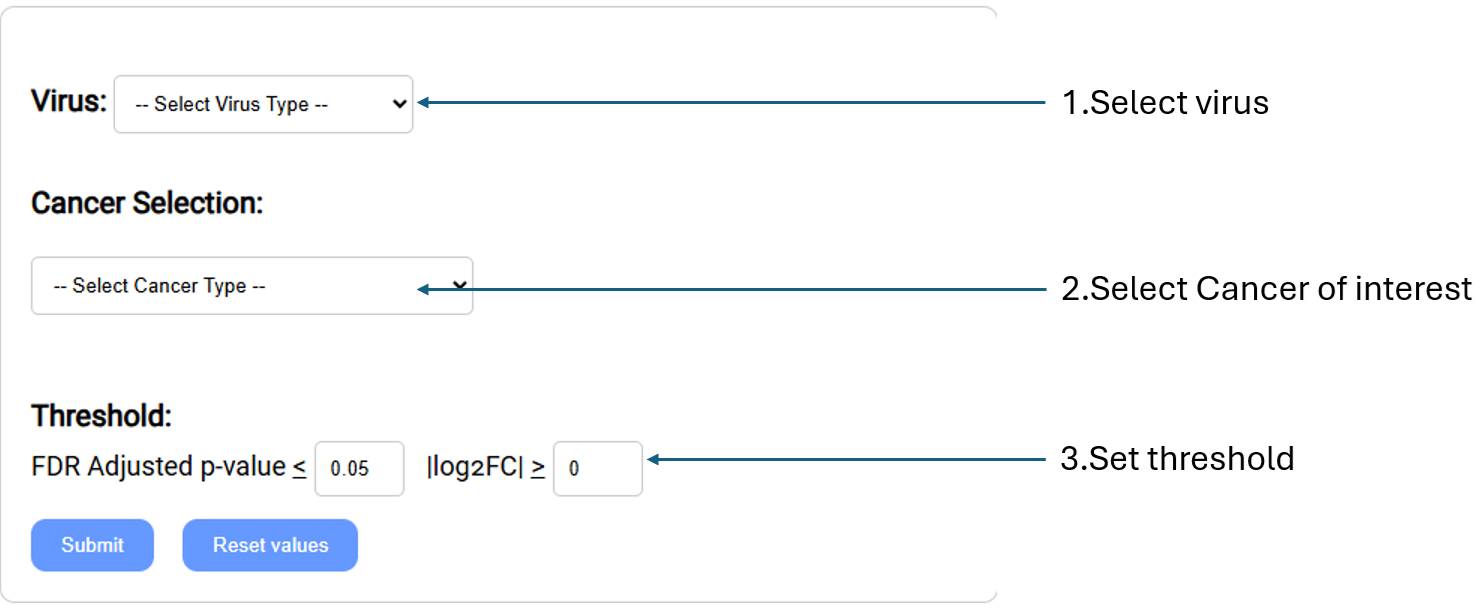
Retrieve the list of genes whose expression levels are most differential between viral and non-viral cancer samples.
- Virus: Select virus type of interest from the drop-down menu.
- Cancer Selection: Select cancer type of interest from the drop-down menu.
- Threshold: Settings used to filter gene list.
- FDR Adjusted p-value:Set custom FDR(False Discovery Rate) adjusted p-value (q-value). Return genes with a q-value equal to or lower than threshold.
- |log2FC|:Set the log2 transformed fold change threshold. (upregulated/downregulated)
|
| -Differential methylation |

Retrieve the list of genes whose methylation levels are most differential between viral and non-viral cancer samples. (Methylation data is measured by Infinium HumanMethylation450K BeadChip)
- Virus: Select virus type of interest from the drop-down menu.
- Cancer Selection: Select cancer type of interest from the drop-down menu.
- Gene region: Select the gene region of interest from the drop-down menu.(Promoter, GeneBody, Promoter+GeneBody) are interested (Promoter, GeneBody, Promoter+GeneBody).
- Threshold: Settings used to filter gene list.
- FDR Adjusted p-value:Set custom FDR(False Discovery Rate) adjusted p-value (q-value). Return genes with a q-value equal to or lower than threshold.
- |Δβ|: Set custom beta difference value
(beta value is to show the methylation level).
|
| -Survival Plots |

Perform survival analysis on patients of specified viral-cancer or non-viral cancer stratified by the expression or methylation levels of the gene of interest. A Survival plot showing percent survival vs time is provided for viral-cancer and non-viral cancer.
- Virus: Select virus type of interest from the drop-down menu.
- Gene: Select gene input format (Gene symbol,Gene Accession,NCBI Gene ID) and enter your gene(s) of interest.
- Gene expression/methylation: Select either expression or methylation profile.
- Cancer Selection: Select cancer type of interest from the drop-down menu.
- Threshold: Setting the threshold to filter patients
- Cutoff(%): Set expression or methylation threshold. Patients whose gene expression/ methylation levels are higher than this threshold are considered as the higher cohort and lower will be the low cohorts.
|
| -Virus Survival Plots |

Perform survival analysis to compare virus vs non-virus samples. The survival plot shows percent survival vs time.
- Virus: Select virus type of interest from the drop-down menu.
- Cancer Selection:Select cancer type of interest from the drop-down menu.
|
| -Clinical Profile |

Get the gene expression and methylation profile for the specified clinical parameters related to viral cancer to compare each stage. A table of p values from the Analysis of variance (ANOVA) tests for the selected clinical parameters is provided.
- Virus: Select virus type of interest from the drop-down menu.
- Gene: Select gene input format (Gene symbol,Gene Accession,NCBI Gene ID) and enter your gene(s) of interest.
- Cancer Selection: Select cancer type of interest from the drop-down menu.
- Clinical Parameter: Select the clinical parameter from the drop-down menu.
- Gene expression/methylation: Select either expression or methylation profile.
|
| -Differential Clinical |

Get the list of genes in viral cancer whose expression or methylation levels are significantly differential between patients stratified by the selected clinical parameter, as determined by Analysis of variance (ANOVA) tests.
- Virus: Select virus type of interest from the drop-down menu.
- Gene expression/methylation:Select either expression or methylation profile.
- Cancer Selection: Select cancer type of interest from the drop-down menu.
- Clinical Parameter: Select the clinical parameter from the drop-down menu.
- Threshold: Setting the threshold to filter list of genes.
- FDR Adjusted p-value:Set custom FDR(False Discovery Rate) adjusted p-value (q-value). Return genes with a q-value equal to or lower than threshold.
|
| -Virus Profile |

Get the viral gene expression within viral cancer with the specific clinical parameter to compare each stage. A table of p-values from Analysis of variance (ANOVA) tests in the selected clinical parameter is provided.
- Virus: Select virus type of interest from the drop-down menu.
- Viral Gene Selection: Select the viral gene of your interest from the drop-down menu.
- Cancer Selection:Select cancer type of interest from the drop-down menu.
- Clinical Parameter: Select the clinical parameter from the drop-down menu.
|
| Clinical Analysis |
| -Survival Analysis |

Perform survival analysis on patients of specified cancer, stratified by the expression or methylation levels of the gene of interest. A survival plot showing percent survival vs time is provided and a list of clinical parameters found significantly different between the stratified groups.
- Gene: Select gene input format (Gene symbol,Gene Accession,NCBI Gene ID) and enter your gene(s) of interest.
- Gene expression/methylation: Select either expression or methylation profile.
- Cancer Selection: Select cancer type of interest from the drop-down menu.
- Threshold: Setting the threshold to filter patients.
- Cutoff(%): Set expression or methylation threshold. Patients whose gene expression/methylation levels are higher than this threshold are considered as the higher cohort and lower will be the low cohorts.
|
| -Clinical Profile |

Get the gene expression and methylation profile for the specific clinical parameter to compare each stage. A table of p-values from Analysis of variance (ANOVA) tests in the selected clinical parameter is provided.
- Gene: Select gene input format (Gene symbol, Gene Accession, NCBI Gene ID) and enter your gene of interest.
- Gene expression/methylation: Select either expression or methylation profile.
- Cancer Selection: Select cancer type of interest from the drop-down menu.
- Clinical Parameter: Select the clinical parameter from the drop-down menu.
|
| -Differential Genes in Clinical Parameter |

Retrieve the list of genes whose expression or methylation levels are significantly differential between patients stratified by the selected clinical parameter as determined by Analysis of variance (ANOVA) tests.
- Gene expression/methylation: Select either expression or methylation profile.
- Cancer Selection: Select cancer type of interest from the drop-down menu.
- Clinical Parameter: Select the clinical parameter from the drop-down menu.
- Threshold: Setting the threshold to filter list of genes.
- FDR Adjusted p-value:Set custom FDR(False Discovery Rate) adjusted p-value (q-value). Return genes with a q-value equal to or lower than threshold.
|